Water scarcity report - 30th May 2024
Thurso and Orkney have raised to Early Warning for water scarcity. The North and Northwest remain at Early Warning. With recent rain, the Ness catchment has recovered to normal conditions.
Situation summary
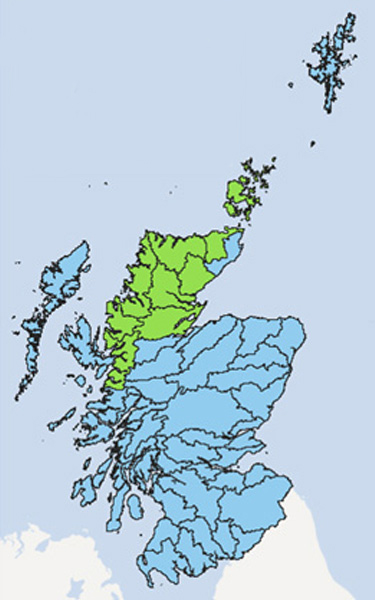
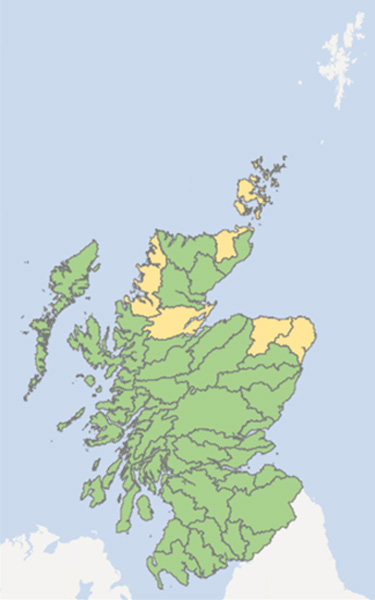
The map of Scotland indicates that there is an early warning for water scarcity levels for this week in the following areas: Area 1, Area 2, Area 3, Area 4, Area 5 and Area 6
Despite some heavy rainfall in parts of Scotland over the last week much of the north and northwest of the country remain in Early Warning. Dry ground conditions and low river flows have seen Thurso and Orkney raised to Early Warning.
There has also been recovery, with the Ness catchment returning to Normal Conditions.
Groundwater levels at most monitoring locations have recovered over the winter period and are normal or high for the time of year. SEPA is monitoring the situation and coordinating steps to manage water resources in line with Scotland's National Water Scarcity Plan.
What do the map colours mean?
| Normal conditions | Early warning | Alert | Moderate scarcity | Significant scarcity |
|---|---|---|---|---|
| Blue | Green | Yellow | Orange | Red |
Weather forecast
Scattered showers developing on Thursday but lighter than recent days. Outbreaks of light rain on Friday, mainly in the west, then dry on Saturday. Outbreaks of light rain in the north and west on Sunday but mostly dry in the east. Mainly dry on Monday.
The rainfall outlook for the May-July period suggests that across the UK there is a moderately greater chance of a wet season overall compared to normal. Wet conditions are slightly more likely at the start of the period than later on.
Advice for water users
We advise water users, including those with private water supplies, to be aware of the potential risk of water scarcity this summer, and for businesses to plan ahead where possible.
Water scarcity in your area
You can help us by reporting any evidence you see of water scarcity. Find out more details of information that would be useful to us and where to send it.
Supporting information
Rainfall and river flows
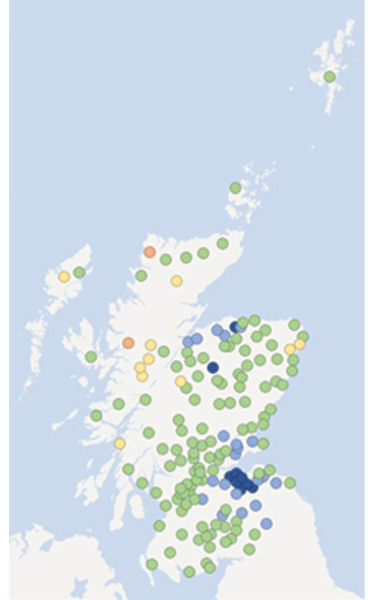
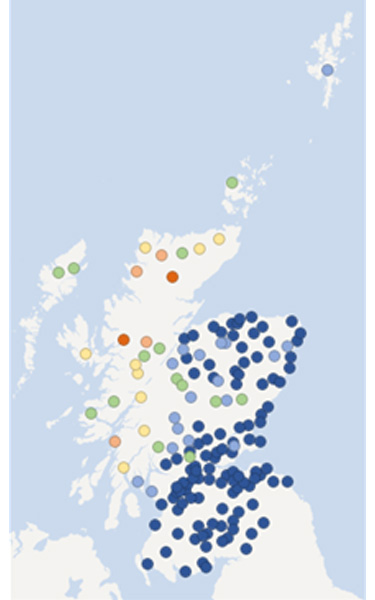
These maps below show rainfall and river flow relative from each rainfall monitoring station to the long-term average, for this time of year, over the last 30 days, 90 days, and 180 days.
Short-term rainfall maps show mostly normal conditions across the majority of the country, with some very wet conditions in the eastern part of the central belt. Over the last month, river flows have generally been quite low with low flows in parts of the north and west. River flows in the south and east remain mainly normal or high.
In the longer term, river flows have been very high in the south and east due to the wet winter/spring. North of the Great Glen, however, conditions have been quite dry and river flows have been widely low.
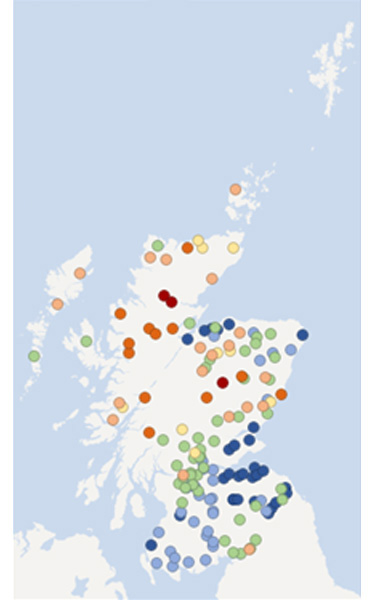
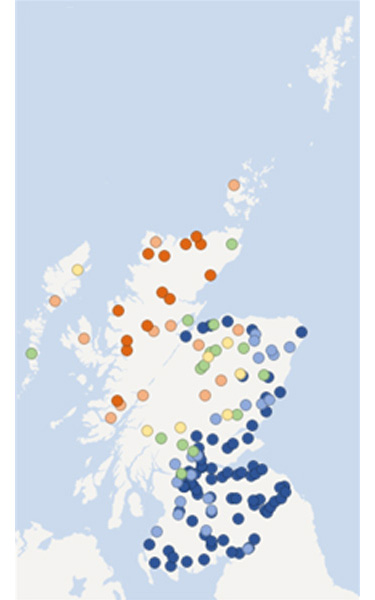
What do the map colours mean?
| Rainfall | Extremely dry | Very dry | Dry | Quite dry | Normal conditions | Wet | Very wet |
|---|---|---|---|---|---|---|---|
| River flow | Extremely low | Very low | Low | Quite low | Normal conditions | High | Very high |
| Red | Orange | Light orange | Yellow | Green | Light blue | Dark blue |
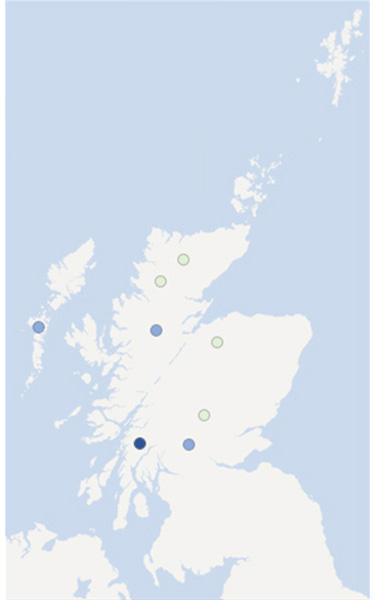
Soil moisture deficit
These maps show this week’s soil moisture deficit, alongside that of our previous report for comparison.
This is obtained from the Met Office Rainfall and Evaporation Calculation System (MORECS). Ground conditions have mostly returned to normal across much of the country, with the exception of parts of the north highlands and north east where quite dry conditions remain.
What do the map colours mean?
| Extremely dry | Very dry | Dry | Quite dry | No deficit |
|---|---|---|---|---|
| Red | Orange | Light orange | Yellow | Green |
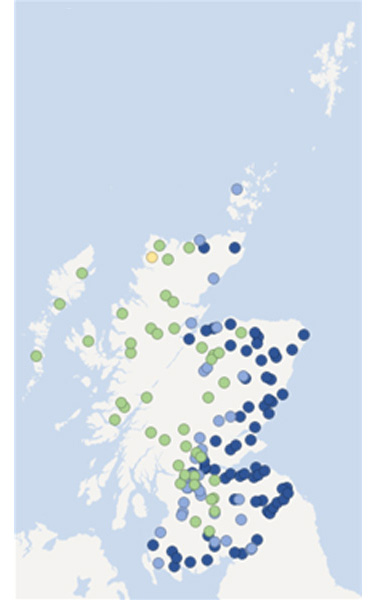
Natural water storage
In each river catchment there is some degree of natural water storage, which can maintain river flows even when it is not raining. This natural water storage is mainly held in lochs and groundwater. When storage has been depleted it will take a lot of rainfall for levels to recover.
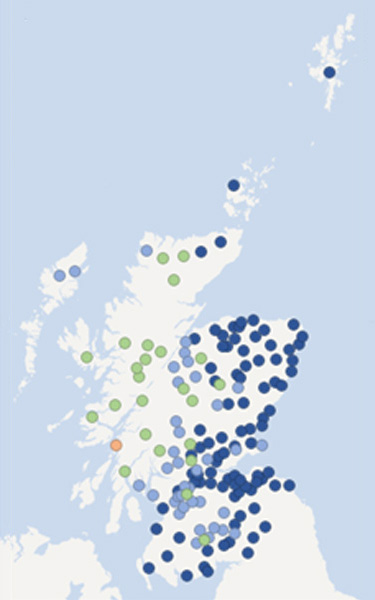
The maps below show recent groundwater and loch level compared to the long-term record at each individual station. Level is reported as high or low compared to the typical (‘normal’) level range for the time of year. Level ranges are specific to each station and based on the long-term (minimum 10 years) record of mean monthly level values recorded at individual stations.
Groundwater and loch levels
Over the last month groundwater levels have recovered to normal or above at all monitoring locations and loch levels have also recovered and all monitored lochs are within the typical range or above for this time of year.
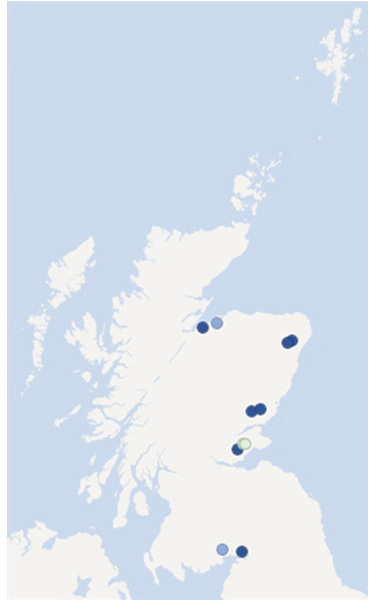
What do the map colours mean?
| Very high | High | Normal range | Low | Very low |
|---|---|---|---|---|
| Dark blue | Light blue | Light green | Light orange | Dark orange |
Flow, rainfall and groundwater data are accessed via SEPA’s time series data service (API). SEPA's live data are subject to ongoing quality control and periodic review.
Map copyright
- Current water scarcity levels - © SEPA. Some features of this information are based on digital spatial data lincesed from the Centre for Ecology and Hydrology © NERC (CEH). Contains OS data © Crown copyrgiht (and database right).
- Rainfall, river flow, groundwater and loch levels - Base map © OpenStreetMap contributors.
- Soil moisture deficit - Data based on MORECS (Met Office © Crown Copyright). Some features of this information are based on digital spatial data licensed from the Centre for Ecology and Hydrology © NERC (CEH). Contains OS data © Crown copyrgiht (and database right). Base map © OpenStreetMap contributors.